
IGA CAPITAL WEEKLY MACRO UPDATE
"The S&P 500 finished the week essentially flat (up 0.1%), concluding a volatile stretch where oil price spikes, Federal Reserve policy signaling, and nonfarm payroll data each dictated market direction. The trading week opened with direct military exchanges between the U.S. and Iran—the first direct engagement since July—driving energy equities higher while placing immediate upward pressure on Treasury yields."

Sept 8th, 2026
The sell-off reversed midweek following comments from Fed Governor Christopher Waller, who signaled potential support for holding policy rates steady should inflation continue its downward path. However, market optimism unspooled following the Friday jobs report. August nonfarm payrolls expanded by 162,000 (compared to the consensus estimate near 55,000), alongside a combined +55,000 upward revision to the prior two months.
A technical analysis of the labor data suggests a more nuanced narrative:
Revisions & Trajectory: Historically, initial August payroll readings are subject to downward revisions. The three-month moving average of 71,000 offers a clearer representation of labor demand, signaling modest growth rather than an overheating labor market.
Broader Economic Indicators: Underlying economic releases reflect ongoing expansion alongside persistent input cost pressures. ISM Manufacturing eased to 54.6 (remaining in expansion territory for an eighth consecutive month) with the Prices Paid sub-index elevated at 71.1. Concurrently, ISM Services accelerated to 55.4 driven by new orders, while July JOLTS job openings dipped to 7.27 million with the quits rate holding below 2.0%.
Treasury Yield Dynamics & Interest Rate Outlook
Treasury yields edged higher across the curve over the week, driven by geopolitical risk and shifting rate expectations.

Key Yield Tenors (as of September 8, 2026)
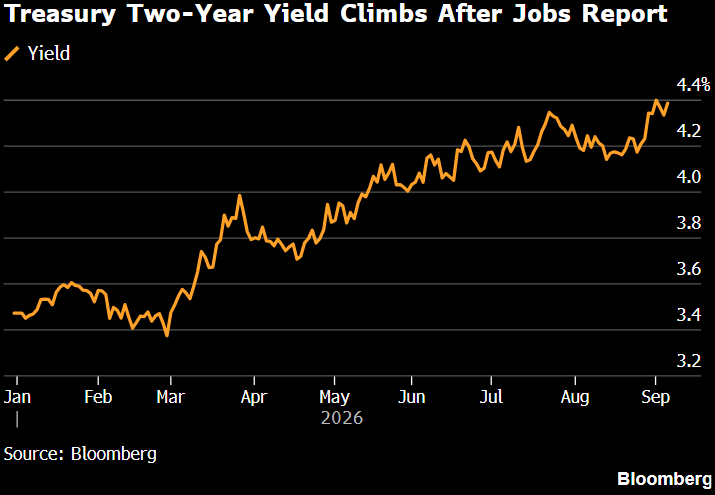
2-Year UST: 4.38% (Tested a high of 4.40% post-payrolls)
5-Year UST: 4.56% (Up from 3.71% in January 2026)
10-Year UST: 4.80% (Up 15 bps month-over-month; highest levels since 2023)
30-Year UST: 5.26% (Finished up approximately 4 bps for the week)
Yield Curve Mechanics & Treasury Refunding Pressure
Front-End Volatility: The 2-year Treasury yield reacted sharply to Fed commentary and economic data, rising above 4.40% following Iran hostilities and Jackson Hole momentum, retreating to 4.30% post-Waller remarks, and re-testing highs after the jobs release.
Long-End Stability: The 10-year Treasury yield closed near 4.80% (up 15 bps month-over-month), while the 30-year Treasury yield anchored at 5.26%. Long-dated Treasuries absorbed an 8% rally in crude oil and a strong payrolls print without breaching key resistance levels, supported by Treasury buyback mechanisms.
Supply Test Ahead: Treasury refunding operations face an upcoming supply test featuring $67 billion in 10-year and 30-year auctions, coupled with expanded $4 billion+ buyback operations in the 10-to-30-year bucket.
Federal Reserve & Policy Rate Probabilities
Following Governor Waller's remarks, market pricing for a Federal Reserve rate hike at the September 16th FOMC meeting fluctuated before settling at an implied 59.9% probability.

FOMC Policy Rate Projections (SOFR / Futures Data)
Current Implied Rate: 3.63%
September 16, 2026 Meeting: 3.78% implied rate (+0.15% change; 59.9% hike probability)
October 28, 2026 Meeting: 3.84% implied rate (+0.22% change; 26.6% hike probability)
December 09, 2026 Meeting: 4.04% implied rate (+0.35% change; 53.2% hike probability)
June 09, 2027 Meeting: 4.22% implied rate (+0.54% change)
The Federal Reserve has held rates steady across consecutive meetings while monitoring inflation trends. Upcoming CPI and PPI data releases remain key inputs ahead of the September policy decision. For commercial borrowers and capital originators, benchmark borrowing rates (anchored by the 10-year UST at 4.80%) continue to reflect a higher-for-longer yield environment.
Economic Calendar & Key Data Releases

Monday, September 7, 2026 (All Day): Labor Day Holiday (US Markets Closed)
Tuesday, September 8, 2026: 3-Year U.S. Treasury Auction
Wednesday, September 9, 2026 (1:00 PM EST): 10-Year U.S. Treasury Auction ($67BN Total)
Thursday, September 10, 2026 (8:30 AM EST): Producer Price Index (PPI) / Jobless Claims
Thursday, September 10, 2026 (1:00 PM EST): 30-Year U.S. Treasury Auction
Friday, September 11, 2026 (8:30 AM EST): Consumer Price Index (CPI)
Friday, September 11, 2026 (10:00 AM EST): U. of Mich. Consumer Sentiment
Wednesday, September 16, 2026 (8:30 AM EST): U.S. Retail Sales
Wednesday, September 16, 2026 (2:00 PM EST): FOMC Interest Rate Decision
Market Snapshot & Benchmark Indicators
Commodities, FX, & Global Sovereign Yields
Crude Oil: WTI Crude expanded to $93.85/bbl (+22.0% month-over-month) driven by Middle Eastern geopolitical risks.
Precious Metals: Gold traded at $4,400.16/oz (+3.8% MoM), while Silver stood at $66.07/oz.
Foreign Exchange: USD/JPY traded at ¥154.14, EUR/USD at €0.86, and GBP/USD at £0.74.
Sovereign 10-Year Yields: U.S. 10Y at 4.80%, U.K. Gilts at 5.17%, Australia 10Y at 5.19%, Canada 10Y at 3.78%, and German Bunds at 3.37%.
Real Estate & Capital Market Performance
Commercial Real Estate Indices: DJ US Real Estate Index closed at 385.3 (-2.1% MoM), Residential REIT ETF (REZ) at $93.25, and Mortgage REIT ETF (REM) at $21.79.
Equity Benchmarks: S&P 500 closed at 7,719, Dow Jones Industrial Average at 53,414.3, and NASDAQ Composite at 26,507.
For inquiries or to discuss structured capital, trade finance, or debt placement requirements, please contact the IGA Capital Deal Team at info@iga.capital.


Comments