
IGA Weekly Macros- Sep 14
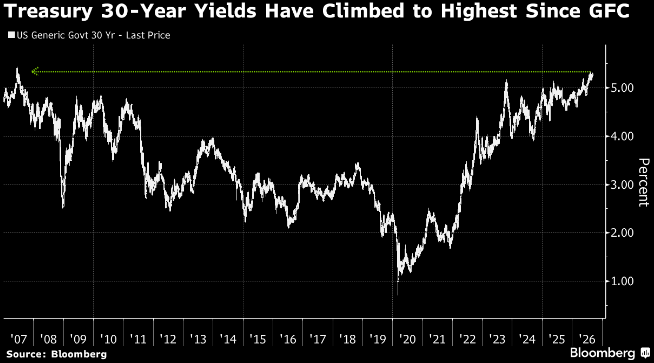
Global financial markets faced severe volatility last week as an escalating energy crisis in the Middle East drove Brent crude past $100/bbl, pushing the U.S. 10-year Treasury yield to touch 5.00%—a threshold crossed only once before since 2007.
The disinflationary narrative anchoring broader asset classes has been upended by back-to-back upside inflation prints and acute supply chain shocks across major maritime bottlenecks. With August Core CPI accelerating to 0.3% MoM and Supercore climbing 0.5% (its fastest pace since January), money markets have moved to price a ~90% probability of a 25 bps rate hike at this Wednesday’s FOMC meeting (September 16), with two full hikes priced in by year-end.
Simultaneously, U.S. equity markets are undergoing a noticeable rotation: institutional investors executed $14.2 billion in equity outflows over the past three weeks—the largest since January—moving into cash equivalents, money market funds, and short-duration paper.


Core Market Indicators (Week Ending Sept 11, 2026)
Indicator / Asset Class | Level / Current Print | WoW Change / Position | Key Analytical Takeaway |
S&P 500 Index | 7,657.0 | -0.8% WoW (-1.9% MoM) | Worst stretch since June; defensive options positioning below 7,600. |
Brent Crude Oil | $105.00 / bbl | +8.7% WoW (+27.6% MoM) | Crossed $100/bbl on Hormuz & Saudi pipeline shutdown. |
10-Year UST Yield | 4.96% (Peak: 5.00%) | +27 bps MoM (+89 bps YoY) | Bruising selloff; long end outperformed on Friday flattening. |
2-Year UST Yield | 4.63% | +5 bps on Friday | Hike premium added; yield curve flattening (2s10s at +33 bps). |
August Headline CPI | 3.4% YoY | In Line (0.0% MoM change) | Gasoline, wireless telecom, and shelter remain key persistent drivers. |
August Core CPI | 0.3% MoM | Above Consensus (0.2%) | Supercore service inflation jumped 0.5% MoM, highest since Jan. |
August PPI | 5.4% YoY (0.4% MoM) | +0.7% MoM change | Rapid input cost expansion signals producer price pass-through. |
Implied Sep FOMC Hike | ~88.1% - 90% | Up from ~50% WoW | Markets price 25 bps hike to 3.75%–4.00% target band. |
Geopolitical Energy Shock: Strait of Hormuz & Saudi Infrastructure
The primary catalyst driving inflation expectations higher is an acute physical supply crisis across key Middle Eastern energy corridors:
Strait of Hormuz & Bab el-Mandeb Stranglehold: Houthi forces seized Mayun Island at the entrance to the Bab el-Mandeb strait, positioning Iran-backed groups with strategic control over a secondary global energy corridor.
East-West Pipeline Shutdown: Saudi Arabia was forced to close its East-West pipeline following targeted Houthi attacks. The closure eliminates a critical workaround capable of transporting 7 million barrels per day around the Strait of Hormuz.
Inflationary Impulse: With both Hormuz transit routes and the Saudi bypass simultaneously impaired, Brent settled at $105/bbl (+8.7% WoW) after peaking above $107/bbl. The crude surge directly challenges the Fed's inflation path ahead of the September 16 FOMC decision.
Inflation & Federal Reserve: Warsh’s First Test
The Federal Open Market Committee enters its September 15–16 meeting under strict blackout conditions, leaving interest rate futures to signal market expectations:
Implied FOMC Rate Trajectory vs. Effective Rate
Current Effective Fed Funds Rate: 3.63%
September 16, 2026 Meeting: 3.85% (88.1% to 90.0% Implied Hike Probability)
October 28, 2026 Meeting: 3.96% (Cumulative ~34 bps of tightening priced)
December 09, 2026 Meeting: 4.13% (Two Full Hikes Fully Priced In)
June 09, 2027 Mid-Year Meeting: 4.51% (Projected Terminal Rate Peak)
The Policy Dilemma for Chair Warsh: The Committee faces a complex choice. Volatile energy shocks and capital-intensive AI spending—the twin drivers of current inflation—are historically less sensitive to traditional short-term rate increases. However, holding rates steady against 3.4% CPI, 5.4% PPI, and $105 oil risks undermining central bank credibility.
Rate Swap Pricing: Swap markets reflect an 88.1% to 90% probability of a 25 bps rate increase on Wednesday, pushing the target rate to 3.75%–4.00%. Two full 25 bps increases are fully priced in by the December 9 meeting (4.13%), with market projections extending toward 4.51% by mid-2027.
Fixed Income & Yield Curve Structural Dynamics

The U.S. Treasury market registered a sharp selloff across the curve before finding technical support late Friday:
Yield Benchmark Performance: The 10-year Treasury yield surged from 4.79% at open to hit 4.97%–5.00%, while the 30-year reached 5.37%—its highest level since 2007.
Treasury Buyback Execution: Market friction escalated Thursday after the U.S. Treasury accepted only $5.19BN of $10.49BN offered in its long-end buyback operation, missing its $6.00BN target. While Treasury leadership dismissed concerns, primary dealers noted that buybacks cannot offset structural fiscal headwinds.
Fiscal Deficit Pressures: The U.S. federal budget deficit reached $1.97 trillion through the first 11 months of the fiscal year. Structural supply pressures are supporting elevated long-end yields independent of near-term FOMC rate adjustments.
Curve Flattening: Friday's core CPI print generated a bear-flattening move: the 2-year yield rose 5 bps to 4.63%, while 10-year yields held at 4.97% as long-end investors stepped in on expectations that Fed tightening will eventually anchor long-term price expectations.


Macro Economic Data & Supply Calendar
Imminent Economic Releases (This Week)
Monday, Sept 14: Light economic calendar.
Tuesday, Sept 15: Empire State Manufacturing Survey.
Wednesday, Sept 16: U.S. Retail Sales (8:30 AM EST) | FOMC Rate Decision & Policy Statement (2:00 PM EST).
Thursday, Sept 17: Weekly Jobless Claims | U.S. Housing Starts & Building Permits.
Friday, Sept 18: Industrial Production & Capacity Utilization.
Out-Week Economic & Auction Calendar (Next Week)
Central Bank & Sentiment: Fed Governor Goolsbee Speaks | U. of Mich. Consumer Sentiment.
PMI Data: S&P Global U.S. Manufacturing PMI | S&P Global U.S. Services PMI.
Housing & Orders: New Home Sales | Durable Goods Orders.
Treasury Auctions: $13BN 20-Year Bond Auction | $19BN 10-Year TIPS Auction | 5-Year UST Auction | 7-Year UST Auction.
Tactical Asset Allocation & Risk Considerations
Duration Strategy: Re-entry into long-duration paper requires caution given the $1.97TN fiscal deficit backdrop and upcoming 20-year bond and 10-year TIPS auctions. Short-duration Treasuries (1M–6M T-bills yielding ~3.86%–4.14%) offer attractive yield ex-duration risk while policy paths settle.
Equity Sector Exposure: Equity downside risk remains tied to rate fluctuations. Over 60% of market participants identify rising yields as the top risk for equities. Energy equities continue to show positive momentum, whereas mega-cap tech valuation multiples remain sensitive to 5.00%+ long-end yields and emerging AI development discussions.
Commercial Real Estate (CRE) & Debt Capital: Fannie Mae 10/9.5 gross rates are pricing elevated borrowing costs above Treasury benchmarks. Capital deployment strategies should factor in SOFR forward curves stabilizing above 4.50% through 2027.
For inquiries regarding institutional portfolio positioning or CRE financing, please reach out directly info@iga.capital


Comments