
IGA Capital | Weekly Economic Update
- Joshua Hawley
- Jun 9, 2025
- 3 min read
Joshua Hawley, CEO
Date: June 9, 2025
Sources: Walker & Dunlop, Bloomberg
Global Macro Overview: Caution in the Cycle
The macro narrative is dominated by the gradual unwind of restrictive monetary policy amid slowing inflation, moderate growth, and a return to yield curve normalization. Despite volatility across asset classes, one thing is clear: the market expects easier policy ahead, and that expectation is rippling across all corners of fixed income and commodities.

Gold & Commodities: Inflation Hedge Still in Command
Gold surged to $3,316.66/oz, marking a +68.7% YoY increase and continuing to outperform equities and real estate. Drivers include:
Declining real yields
Global FX instability (JPY, GBP, CAD depreciation vs USD)
Hedging behavior from sovereigns and institutions
Flat-to-falling SOFR and TIPS yields making non-yielding assets like gold attractive
Oil & Silver
Silver gained a striking +11.8% MoM, reflecting both its precious metal appeal and industrial utility.
Oil (WTI) rose to $64.87, but remains well below 2024 levels due to mixed global demand and inventory overhang.
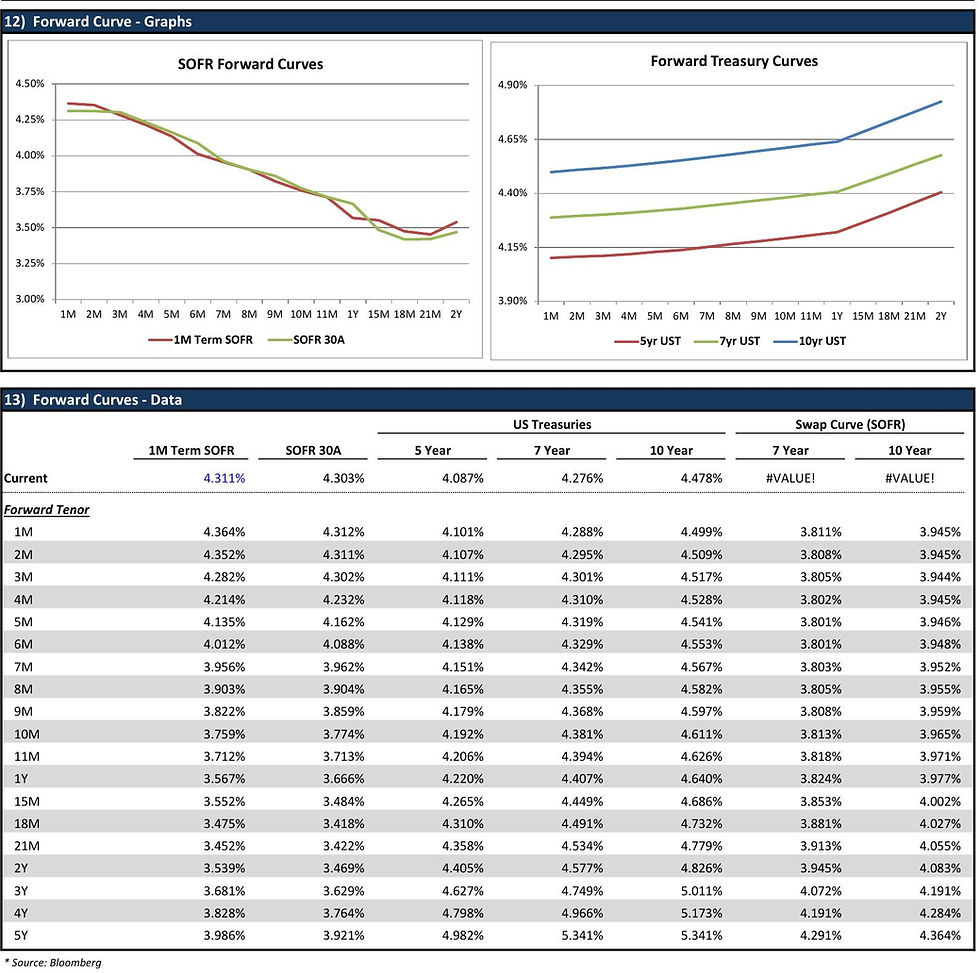
Fixed Income Market: Gradual Shift, Not Panic
SOFR & Swap Curves
The 1M Term SOFR is at 4.31%, down from 5.33% a year ago. The forward curve projects a soft decline, reaching 3.57% in one year. This reflects broad consensus that the Fed is finished hiking and may execute 4–6 cuts over the next 12 months.
Implied 10Y SOFR swap rate is currently at 3.95%, still pricing risk premium amid uncertain inflation stickiness.
SOFR Cap Pricing:
Hedging costs have come down meaningfully:
3-year cap at 4.00% strike: ~1.04% cost (notional-based)
5-year cap at 4.50% strike: ~1.59% cost
This presents opportunities for borrowers to lock protection affordably.
U.S. Treasuries: Curves Are Normalizing
10-Year UST Yield: 4.48% (↑10 bps MoM)
2s/10s spread: Now +0.47%, steepening YTD as short-end pressure eases
Forward curve shows modest flattening: Q4 2025 forecasts cluster around 4.20–4.30%, though implied forwards suggest slightly higher yields
Treasury Forecast Bands (Q4 2025):
High Estimate: 5.00%
Low Estimate: 3.50%
Median: 4.20%
The market is caught between falling inflation data and persistent issuance concerns. The Fed is softening, but fiscal supply and QT remain potent counterweights.
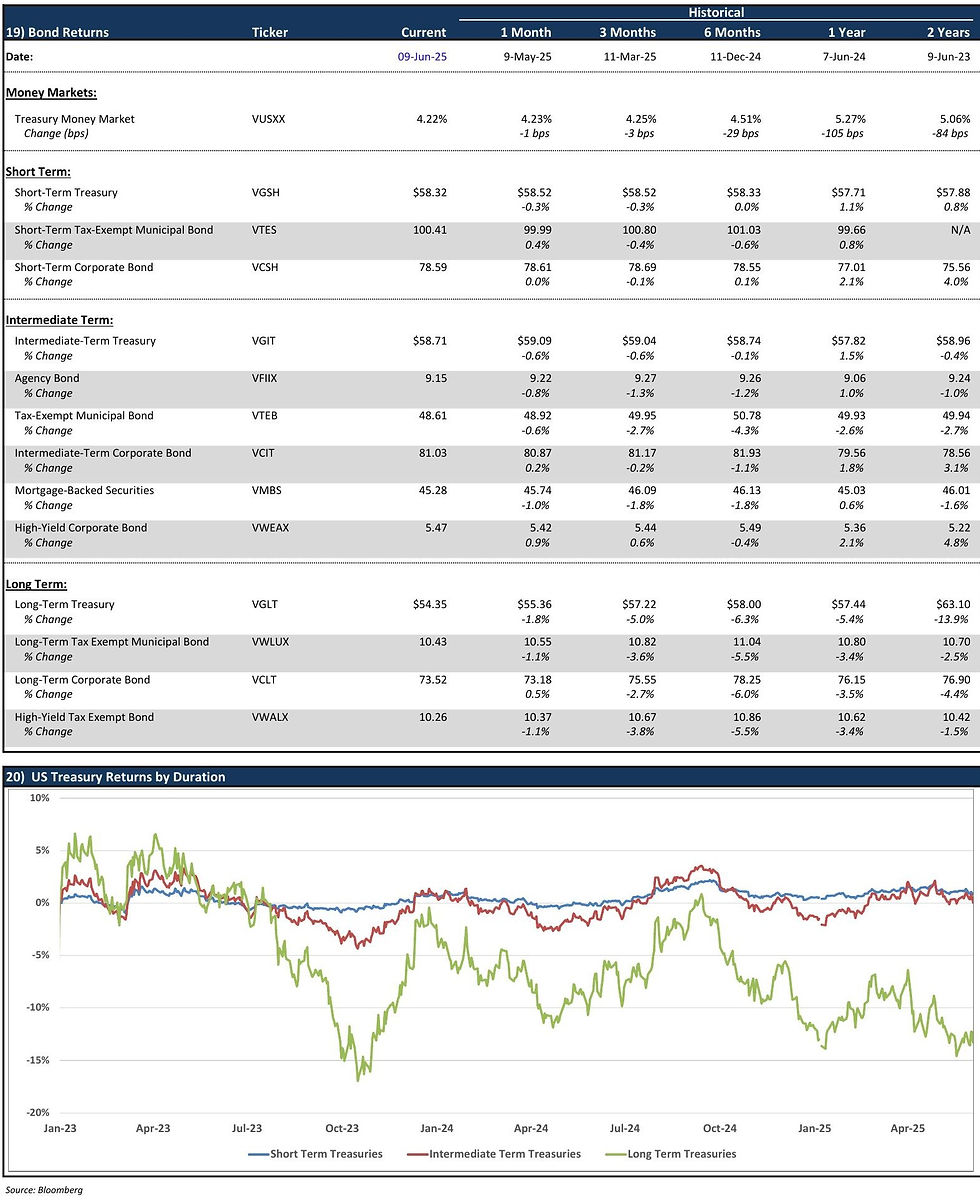
Bond Market Performance
The bond market remains highly bifurcated:
Long Duration Weakness
VGLT (Long-Term Treasuries): -13.9% YoY
VCLT (Long-Term Corporates): -4.4% YoY Duration risk remains toxic in portfolios not actively managed or hedged.
Short & Intermediate-Term Bonds
Short-Term Treasuries (VGSH): +0.8% YoY
Intermediate Corporates (VCIT): +3.1% YoY
High-Yield (VWEAX): +4.8% YoY

Credit spreads are still tight, but showing signs of mild widening in the lower-rated space. The market is rewarding moderate duration with high quality, especially where floating exposure is available.
Summary Dashboard
Metric | Value | Trend |
Gold | $3,316.66/oz | ↗ +68.7% YoY |
1M SOFR | 4.31% | ↘ softening |
10Y UST | 4.48% | ↗ +10 bps |
SOFR 3Y Cap @ 4% | ~1.04% cost | ↘ declining |
S&P 500 | 6,000 | ↗ 39.4% YoY |
VGLT (Long Treasury) | $54.35 | ↘ -13.9% YoY |
Key Dates Ahead:
June 11: CPI & 10Y Auction
June 18: FOMC Meeting
June 26–27: GDP & PCE Data
July 9 & 30: 10Y Auction + FOMC IGA Capital’s Take:
Investors and sponsors must adapt to a new paradigm:
SOFR is drifting lower, but still poses floating-rate risks over time.
Fixed income isn’t dead—but it’s credit and structure selective.
Gold's strength is a signal: global confidence in policy frameworks is eroding.


Comments